

Introduction
The Islamic finance value chain begins with Islamic banking and continues through to the takaful business and into capital markets. At the tail end of this value chain, Islamic asset management exists to service the investment needs of these other components.
The Islamic asset management industry has shown formidable progress in recent years. No other financial industry, market or jurisdiction in the last decade has experienced such a remarkable growth. Globally, the Shari’a-compliant AUM has grown to USD 52.3 billion with approximately 800 funds, in comparison to the conventional mutual funds’ universe of 70,000 funds which accounts for almost USD 19 trillion in assets un- der management (AUM).
As Islamic equity is fast becoming a popular asset class, understanding the factors influencing the performance of Islamic equity indices will help make Islamic investing a viable alternative to conventional equity investing based on comparable risk-return indices performance.
This analysis also serves to shift the mindset of investors regarding Socially Responsible Investing (SRI). Most American, European, Japanese and Australian pension houses have provided specific allocation for SRI portfolios and ethical investments. Islamic investing goes beyond a traditional ethical investment approach because an additional layer of risk management exists on top of the SRI / ethical screening. This built-in layer of risk management delivers the “coup de grace” of Islamic investing – high-quality assets with strong fundamentals and low debt-to-equity ratios are examples of criteria that stocks must fulfil in order to be considered Shari’a-compliant.
Mitigating the core misconception on Shari’a performance
A core misconception is the view that the pursuance of a Islamic investing approach will result in a significant performance drag because the investment universe is limited in comparison to the conventional investment universe. While it is understandable that investors in UK, Europe and the U.S.A possess this misconception, we believe that this analysis will clarify and deepen the understanding of the nature of Islamic investment performance and its total return.
The evidence will show that a Islamic equity investment approach grants comparable risk-return performance. The resulting investment universe is an outcome of sound investment screening which produces a more stable portfolio with resilient characteristics in a down trending market. The financial ratios screening that is part and parcel of the Islamic equity investment approach serves as an automatic and embedded quantitative portfolio risk management overlay. The Dow Jones Islamic Market World Index (DJIM World) has a universe of 2,374 stocks, which is 20% of the Dow Jones Global Index (DJ Global) of 11,970 stocks. However, its market capitalization of USD 12.3 trillion2 is 40% of the Dow Jones Global Index’s total market capitalisation of USD 31.2 trillion.
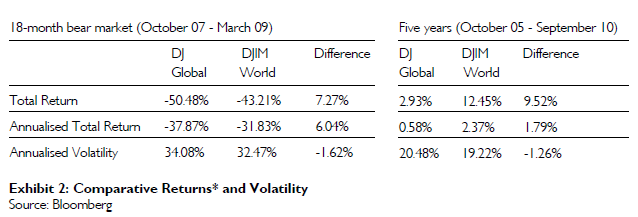
The meltdown of global equity markets in 2008 that was precipitated by high global inflation due to the in- crease of oil prices is a case in point. The screening be- yond ethical/permissible stocks showed that during the period from October 2007 to March 2009, the DJIM World’s total return was 7.27% higher than the DJ Glo- bal. (Total Return: DJ Global: -50.48% vs. DJIM World:
-43.21%). The Islamic index, therefore, demonstrated a more stable and less volatile portfolio, providing investors with a more prudent alternative for consideration.
Another myth to Islamic investing pertaining to managing risk is that there are limited hedging capabilities. The popularly held but mistaken view is that the unavailability of Shari’a-compliant hedging instruments might hinder portfolio’s performance. The fact is that the Islamic investment approach permits the use of derivatives for purposes of hedging with proven Shari’a-compliant underlying assets. Derivatives used for hedging are restricted only if there are significant elements of speculation or uncertainty and gambling and can be subjected to exploitation, which is prohibited in Islam. Islamic concepts such as wa’ad and salam are used to transact hedging initiatives. Having mitigated the above core misconceptions, the belief is that there is sustainable value proposition to the performance of Islamic equity investment.
Value proposition to the performance of Islamic investing
The Shari’a–compliant investment process exercises prudence because approved portfolio constituents are companies whose finances are not highly leveraged. The screening process enforces the principle that acceptable Shari’a-compliant stocks should not be involved in excessive risk-taking, high borrowing, and exploitation of contracts.
The SRI approach, practiced by pension houses, does not employ similar financial ratio screening. We believe that the addition of this screening will bring the risk-return performance of ethical investing to the next level. It also demonstrates that in addition to delivering comparable returns with mainstream investing, the Islamic investment approach is more fiscally ethical as it screens out financially risky stocks to provide a more stable and prudent alternative.
Overall, a Shari’a-compliant portfolio will be less exposed to:
- De-leveraging;
- Extreme solvency;
- Liquidity concerns; and
- Portfolio risk management
Benefits of Islamic investing
Besides the socially-responsible motivation, other reasons for conventional investors to invest according to Shari’a include:
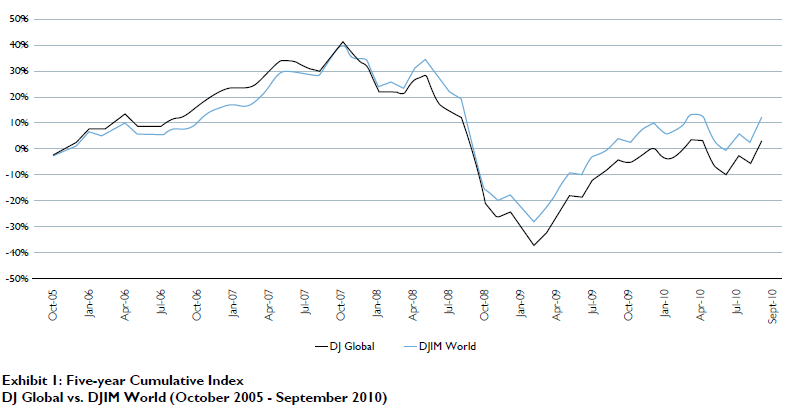
- Comparable returns to conventional investments over longer periods (five years), although they may outperform or underperform conventional investments over shorter periods, as can be seen in Exhibit 1 below. In fact, over the last five years, the DJIM World out- performed the DJ Global by an average of 1.88% per year, returning 10.22% as compared with 0.45%. The same can be said for the period between October 2007 and March 2009, the worst bear market in decades, when the DJIM World reported -43.21% compared to -50.48% for the DJ Global (Exhibit 2).
- Embedded risk management – To be considered Shari’a-compliant, equities must pass a rigorous screening process, which ascertains, among other things, whether the underlying companies are sufficiently capitalised to weather difficult times, and liquid enough to meet short-term obligations. This process sets strict limits for various financial ratios, such as debt-to-total market-capitalisation or debt–to-total-assets ratio to limit leverage, and cash-to-market-capitalisation or cash-to-total-assets ratio to ensure sufficient liquidity and productive use of cash. Due to such rigorous screening, the underlying companies were better capitalized and more liquid than many of their conventional peers. Therefore, they were less exposed to the de-leveraging, extreme solvency, liquidity concerns and the consequent sharp price declines experienced by their peers during the global financial crisis.
- Greater transparency – Since transactions and contracts must be free of uncertainty, and terms and conditions clearly defined at the outset, Shari’a-compliant investments may produce more predictable results.
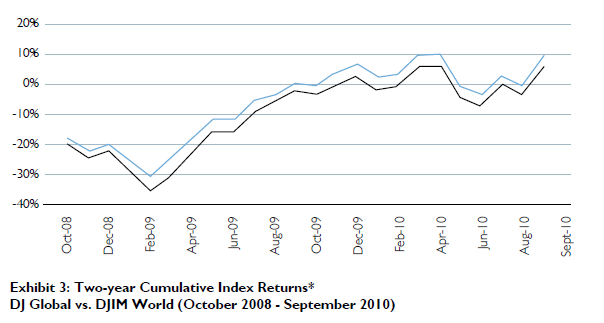
- Diversification – While they are highly correlated, Shari’a-compliant investments limit the downside slightly better than conventional investments do. As shown in Exhibit 2 and Exhibit 3, during the recent bear market, Islamic funds fared better over the period than conventional portfolios did, by declining less, experiencing lower volatility and recovering nearly as much as the ground lost when the markets recovered.
- What is interesting is that even during the 18-month up-trending market from February 2009 to September 2010, the DJIM World outperformed its conventional counterpart consistently. Our analysis below will explain the cause of such behaviour.
Islamic Indices Outperformed Conventional Indices
The past three years have been challenging with investment uncertainty, higher market volatility and increasing investor anxiety. The global equity markets are slumping on sovereign debt troubles and continued doubts about economic recovery. While the road to recovery has not been smooth, Islamic investing has displayed its strength over the conventional investing approach, especially in these volatile times.
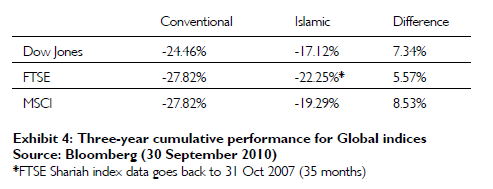
It has been encouraging to observe that all three global Islamic indices by Dow Jones, MSCI and FTSE have been outperforming their own conventional global index counterparts over the last three years. Exhibit 4 shows the cumulative three-year performance of the global Islamic indices and their corresponding conventional indices.
Investing in Islamic equity does not mean one has to sacrifice investment performance. Islamic indices exhibited respectable outperformance of between 5.57%- 8.53% over a three-year period ending 30 September 2010. However, it is not only this outperformance in volatile market conditions that speaks positively for Islamic investing but also its performance across a full market cycle.
While the indices have similar performance, there is still variation across the three Islamic indices. The difference in performance across the Islamic indices may be due in part to the variation in the index construction processes. The differing screening criteria introduced by the various Islamic index providers may cause a variation on the eligible constituent lists.
Qualitative comparison of Islamic index screening processes
Islamic principles are derived from the Quran and Sun- nah, which state very clearly at a core level what is permissible, and confer certainty on what is and is not haram. There is a further layer of debate and refine-ment among Shari’a scholars – ijma and qiyas – where they must come to a consensus and reasoning based on assumptions and analysis of what is permissible. This explains that screening at the permissible industry level generally does not differ but financial ratios screening does result in a variation of the overall constituents. The Shari’a scholars of each respective index provider (Dow Jones, MSCI, FTSE) have come to different consensus on the financial formulas used to interpret and refine the respective index provider’s financial ratios screening. Therefore, each index provider may have slight variations on the screening criteria being followed and consideration must be given to whether those variations materially impact the requirements of the respective index users.
Islamic index construction: industry and financial ratio screening
The industry screening processes between the three index providers are similar. The main variation is in the financial ratio screening where DJIM World measures its debt and cash financial ratios over market capitalization while FTSE and MSCI measure them over total assets. Computing the ratios against market capitalization can result in these ratios being less stable when equity markets are volatile. Market capitalization is the market’s perception of how much the business is worth, and tends to fluctuate subject to market sentiment, economic sentiment, and global macroeconomic factors.
The Islamic financial ratios are more stable when total assets are used instead of market capitalization. Also, with total assets as the base, it will mean that the ratios are derived from the company’s balance sheet and shareholders financial commitments, which will more clearly reflect how financial decisions are made and how management runs the business.
Islamic index maintenance
Each Islamic index provider’s index maintenance re-view frequency will affect the timing of the inclusion and removal of eligible stocks, and hence will have slight varying performances across the Islamic indices. Again, while each index provider may have minor variations on the review frequency, consideration must be given to whether those variations materially impact the requirements of respective index users.
The composition of the DJIM World and MSCI are re-viewed quarterly while the FTSE Global Islamic Index Series is reviewed semi-annually. From a Shari’a-compliance standpoint, the more reviews and rebalances are done to an index, the more accurate the constituent list will be. Meanwhile, from an index user standpoint, if reviews occur too frequently, the index may exhibit more volatility from repeated rebalancing. As such, index review processes should not take place more than on a quarterly basis. Certainly, our recommendation would be to strike a balance where index reviews occur at most on a semi-annual basis.
Performance analysis tf three Dow Jones Islamic Indices And Their Counterparts
The following analysis will look at the factors that influence the outperformance or underperformance of Islamic equity indices and their conventional counterparts. The Dow Jones Islamic Market Indices were selected because of the availability of sufficient track record for analysis. The three pairs of investment indices under examination are:
- Dow Jones Islamic World Market Index and Dow Jones Global Index;
- Dow Jones Islamic Asia Pacific ex-Japan Index and Dow Jones Asia Pacific ex-Japan Index.
- Dow Jones Islamic Emerging Market Index and Dow Jones Emerging Market Index
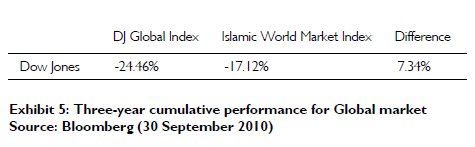
- Dow Jones Islamic Market World Index and Dow Jones Global Index
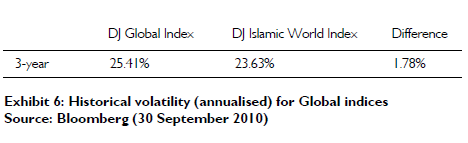
The results show that this is generally in line with our conviction that global conventional and Islamic indices demonstrate comparable performance. On a three-year cumulative basis, the DJIM World outperformed the DJ Global. In addition, the comparison of historical volatility of these two indices reveals that the DJIM World is less volatile by 1.78% over the last three years. (Exhibit 6).
The Dow Jones Global index has 11,970 constituents with a market capitalisation of USD 31.2 trillion. In comparison, the DJIM World has 2,374 constituents with a market capitalisation of USD 12.3 trillion. The more limited Islamic investment universe with 80% fewer constituents delivered comparable performance in a more stable manner than its conventional index counterpart.
Further examination of sector allocation (Exhibit 7) for these two indices reveals that the weight of certain sectors differed widely due to the Islamic principles and screening methodology. The financial sector has a
21.35% allocation of the conventional index, but only a 0.33% allocation of the Islamic index. Therefore, when the financial crisis occurred in September 2008, the Islamic index performance benefited from a lack of exposure to the volatile financial sector.
However, a look at the top constituents of both indices, Exhibit 8, reveals some commonality. In fact, the two indices have the same companies in five out of the top 10 constituents – Exxon Mobil, Microsoft, Johnson & Johnson, Procter & Gamble and IBM. Familiar companies like Microsoft, IBM and Google Inc. are amongst the top 10 constituents of the Islamic index. Well-known oil and gas companies like Exxon and Chevron, and pharmaceutical and healthcare companies Pfizer, Novartis and Johnson & Johnson also rank in the top 10 Islamic index constituents.
Moving away from the developed world, let us examine the performance of an investment universe purported to be the next global growth engine: Asia.
- Dow Jones Islamic Market Asia Pacific ex-Japan Index and Dow Jones Asia Pacific ex- Japan Index
There are a total of 13 countries3 in Asia Pacific ex-Japan including Australia and New Zealand. These nations have proved more resilient, having learnt from the 1997-1999 Asian economic crises. Growth in these countries is being supported by resource-based industries in addition to their growing domestic consumption bases. High productivity in the agriculture and manufacturing sectors has boosted consumer and business confidence. A country like India has grown to be one of the largest exporters of software and other information technology-related services. The region’s economic growth has been a result of the expansion of the financial sector with investment flows moving into China and India. Consistent higher growth than the developed world has been achieved by this group of emerging middle-income economies, while strong domestic consumption coupled with robust exports have kept investor sentiment upbeat on the region.
| DJ Global | DJIM World | ||
| Sector | % | Sector | % |
| Financials | 21.35% | Technology | 18.77% |
| Industrials | 13.00% | Oil & gas | 18.52% |
| Consumer Goods | 11.75% | Health Care | 17.18% |
| Oil & Gas | 9.99% | Industrials | 13.91% |
| Technology | 9.60% | Basic Materials | 12.55% |
| Consumer Services | 9.38% | Consumer Goods | 8.23% |
| Basic Materials | 8.49% | Consumer Services | 6.55% |
| Health Care | 7.97% | Telecommunications | 2.84% |
| Telecommunications | 4.32% | Utilities | 1.12% |
| Utiliites | 4.15% | Financials | 0.33% |
| DJ Global | DJIM World | ||
| Constituent | USD’billion | Constituent USD’billion | |
| Exxon Mobil Corp. | 315.59 | Exxon Mobil Corp. 315.59 | |
| Apple Inc. | 257.30 | Microsoft Corp. 188.49 | |
| Microsoft Corp. | 188.49 | Johnson & Johnson 171.37 | |
| HSBC Holdings PLC (UK Reg) | 178.84 | Procter & Gamble Co. 170.22 | |
| Nestle S.A. | 176.37 | International Business Machines Corp. 169.19 | |
| General Electric Co. | 173.38 | Chevron Corp. 162.47 | |
| Johnson & Johnson | 171.37 | Novartis AG 141.17 | |
| Procter & Gamble Co. | 170.22 | Pfizer Inc. 138.31 | |
| AT&T Inc. | 169.91 | Google Inc. Cl A 128.32 |
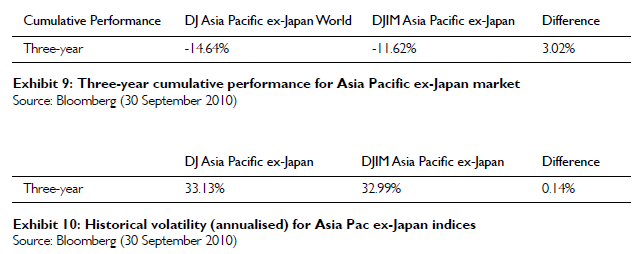
Similar to the global indices comparison earlier, the Dow Jones Asia Pacific ex-Japan Islamic index showed comparable performance against its conventional counterpart.
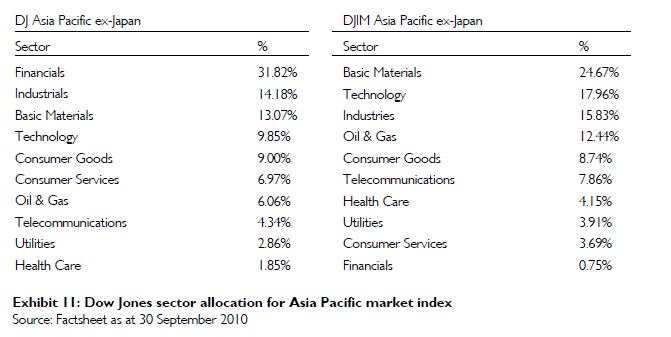
The Dow Jones Islamic Market Asia Pacific ex-Japan index cumulatively outperformed the Dow Jones Asia Pacific ex-Japan conventional counterpart by 3.02% over a three-year period. Similar to the global indices comparison findings, the Islamic index recorded a slightly lower volatility of 0.14% than its conventional counterpart. The conventional index has 3,402 constituents with a total market capitalization of USD 4.5 trillion in comparison to the smaller universe of the Islamic index with 846 constituents and a total market capitalization of USD 1.7 trillion as at 30 September 2010. Once more, the Islamic index recorded similar performance in a more stable manner. Again, this happens even though there is a significant difference in the majority of sector allocation weightings.
With the not-so-smooth economic recovery, sectors like financials, information technology, materials and industrials lagged the broader market, causing downward pressure in the equity market. However, when we compare the top 10 constituents of both indices, there are four common constituents – BHP Billiton, Samsung Electronics, Taiwan Semiconductor and China Mobile. Other familiar names that make up the top 10 list of the Islamic index are Infosys Technologies and Reliance Industries of India, POSCO of Korea and CNOOC Ltd of Korea.
We believe that despite the big difference in sector allocation between the conventional and Islamic indices, where the conventional invests 60% of its top 10 constituents in banks, the Islamic index is more spread out and exhibits diversification of risk from the standpoint of country and sector allocation.
| DJ Asia Pacific ex-Japan | DJIM Asia Pacific ex-Japan | |||
| Constituent | USD’billion | Constituent | USD’billion | |
| BHP Billiton Ltd. | 126.39 | BHP Billiton Ltd. | 126.39 | |
| Samsung Electronics Co. Ltd. | 72.81 | Samsung Electronics Co. Ltd. | 72.81 | |
| Commonwealth Bank of Australia | 71.84 | Taiwan Semiconductor Manufacturing Co. Ltd. | 43.95 | |
| Westpac Banking Corp. | 65.48 | China Mobile Ltd. | 42.67 | |
| Australia & New Zealand Banking Group Ltd. | 58.68 | Infosys Technologies Ltd. | 38.66 | |
| National Australia Bank Ltd. | 52.00 | Reliance Industries Ltd. | 36.32 | |
| Industrial & Commercial Bank of China Ltd. | 51.34 | Hon Hai Precision Industry Co. Ltd. | 30.45 | |
| China Construction Bank Corp. | 44.66 | POSCO | 30.35 | |
| Taiwan Semiconductor Manufacturing Co. Ltd. | 43.95 | Newcrest Mining Ltd. | 29.26 | |
| China Mobile Ltd. | 42.67 | CNOOC Ltd. | 29.07 | |
| Total no of constituents = 3402 | Total no of constituents = 846 | |||
| Total market cap = USD4.52 trillion | Total market cap = USD1.69 trillion1.69 |
Source: Dow Jones (data as at 30 September 2010)
Dow Jones Islamic Market Emerging Markets Index and Dow Jones Emerging Markets Index
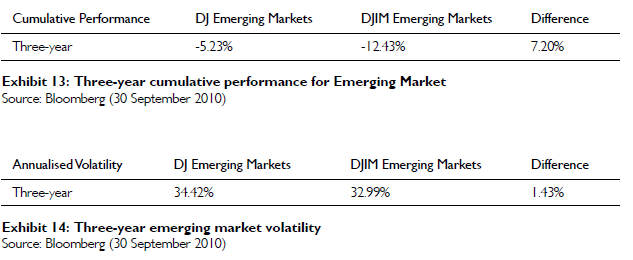
A low quality rally does not favour Shari’a-compliant portfolios which tend to be of higher quality as they are restricted by Islamic guidelines on level of debt. The consistent underperformance of the Islamic emerging markets index versus the conventional emerging mar- kets index is in some way being influenced by the rally on risky assets and also the sector weightings.
Conversely, Exhibit 14 shows that the Islamic emerging market is less volatile than the conventional by 1.43%. This does not mean that the investors’ Shari’a-compliant portfolio will be in tandem with these indices. Having done this analysis, the investment managers who manage Islamic emerging markets will have to relook into value-adding by taking positions outside the index weightage and be more active in quantitative research towards their core belief in superior stock selection for consistent superior performance (alpha).
The Islamic emerging market index contains a larger exposure to the oil and gas, basic materials, technology and telecommunications sectors, compared to the conventional emerging markets index. Meanwhile, the conventional emerging markets index has greater exposure to the financials, consumer services and consumer goods sectors. Emerging market countries have been fundamentally more attractive than developed countries, showing stronger economic growth, more favourable demographics, higher current account surpluses and lower levels of debt at the country, corporate and consumer levels. All these have benefited the financial, consumer services and consumer goods sectors. On the other hand, the oil and gas, basic materials, technology and telecommunications sectors have been affected at a global level and performance of these sectors within the Islamic emerging market index has dragged the overall performance down relative to the conventional emerging markets index.
| DJ Emerging Markets Constituent | DJIM Emerging Markets | |||
| Sector | % | Sector | % | |
| Financials | 26.81% | Oil & Gas | 23.70% | |
| Oil & Gas | 13.24% | Basic Materials | 19.30% | |
| Basic Materials | 13.16% | Technology | 16.12% | |
| Industrials | 11.88% | Industrials | 13.79% | |
| Technology | 9.34% | Telecommunications | 11.93% | |
| Consumer Goods | 8.64% | Consumer Goods | 5.46% | |
| Telecommunications | 6.68% | Health Care | 2.83% | |
| Consumer Services | 5.54% | Utilities | 2.75% | |
| Utilities | 3.19% | Consumer Services | 2.44% | |
| Health Care | 1.52% | Financials | 1.68% |
Source: Factsheet as at 30 September 2010
We also believe that the conventional emerging markets have financial sectors that have been resilient. As banks in emerging markets report better-than-expected results and credit conditions continue to improve, investors are returning to the market and positioning themselves for an emerging market global economic recovery. Exhibit 16 demonstrated that the top 10 constituents of global Islamic emerging market are invested in countries like Brazil, Russia, China and Mexico. Interestingly, the sectors in the top 10 constituents of both indices focus on oil and gas. There are four common constituents out of the top ten of both Islamic and conventional market indices. However, there are six similar companies although with different share types. Three of these common constituents come from the oil and gas sector, namely Petrola Brasileiro S/A, GAZPROM OAO and OGX Petroleo e Gas Participacoes S/A. We believe the uncommon counters which come from technology and basic materials were not performing as good as the financial constituents.
Although the total number of Shari’a-compliant constituents is only 851, its market capitalisation at USD 1.8 trillion is a respected 51% of the conventional market capitalisation.
Unlike the global and Asia Pacific Islamic indices, the DJ Islamic Emerging Markets Index underperformed the DJ Emerging Markets index over three years with higher volatility. We encourage further examination into the attribution of the performance of these indices to shed further light on the difference in performance.
Value-added optimisation for Shari’a performance
The results of the index analyses shed light on what the investment manager must focus on. The Asia Pacific Shari’a-compliant portfolio whose three years annualized volatility at 32.99% is more challenging to manage than a global Shari’a-compliant portfolio whose three years annualised volatility is lower at 23.63%.
The challenge to the investment manager is to provide value by changing the portfolio weights and taking small positions out of the index. Active stock selection can be based on three core beliefs, namely:
| DJ Emerging Markets | DJIM Emerging Markets | |||
| Constituent | USD’billion | Constituent | USD’billion | |
| Petroleo Brasileiro S/A Pref | 71.28 | Samsung Electronics Co. Ltd. | 72.81 | |
| GAZPROM OAO | 63.06 | Gazprom OAO ADS | 63.22 | |
| Petroleo Brasileiro S/A Ord | 57.61 | Petroleo Brasileiro S/A Ord | 57.61 | |
| Vale S.A. Pref A | 55.52 | America Movil S.A.B. de C.V. Series L | 52.86 | |
| America Movil S.A.B. de C.V. Series L | 52.86 | Taiwan Semiconductor Manufacturing Co. Ltd. | 43.95 | |
| Industrial & Commercial Bank of China Ltd. | 51.34 | China Mobile Ltd. | 42.67 | |
| Itau Unibanco Holding S.A. Pfd. | 48.98 | OGX Petroleo e Gas Participacoes S/A Ord | 42.06 | |
| China Construction Bank Corp. | 44.66 | Vale S.A. Ord | 40.27 | |
| China Mobile Ltd. | 42.67 | Infosys Technologies Ltd. | 38.66 | |
| OGX Petroleo e Gas Participacoes S/A Ord | 42.06 | Reliance Industries Ltd. | 36.32 | |
| Total no of constituents = 2,259 | Total no of constituents = 851 | |||
| Total market cap = USD3.56 trillion | Total market cap = USD1.80 trillion |
Source: Dow Jones (data as at 30 September 2010)
- Improving and sustaining business fundamentals;
- Rising investor expectation; and
- Attractive relative valuation
In addition to optimising the portfolio, the investment manager may add value by:
- Evaluating whether major market changes are due to Islamic concerns, market concerns, or perhaps both;
- Evaluating whether pricing differentiation between conventional and Shari’a-compliant securities are due to Islamic interpretations, Islamic market dynamics or imbalance, regulatory requirements, or government initiatives;
- Advising clients on potential benchmarks for their portfolios;
- Identifying risks peculiar to Shari’a-compliant securities and markets, and mitigating them effectively;
- Optimising a client’s portfolio by anticipating market trends that could affect the securities universe; and
- Understanding a client’s Islamic investment needs and then structuring an optimal asset allocation based on the above abilities.
These capabilities coupled with a disciplined investment process should yield sustainable investment returns over the longer term.
Conclusion
Over a longer time period, the Islamic investment approach has merit through a strong bull market, and not just during a down-trending market, as some would ar- gue. For example, from 1 January 2004 to 30 September 2009, the MSCI World Islamic significantly outperformed the MSCI World by over 15%.
The analysis of Islamic equity indices, both quantitatively and qualitatively, shed light on how variations in performance of Islamic indices have come about. Simi- lar performance comparison with conventional equity indices will illustrate that Islamic investment is a clear alternative worthy of consideration by all investors. As Islamic index providers further refine their index construction and maintenance processes, the acceptance of this investment process will gain further credence with mainstream investors.
Both Islamic and ethical funds are for clients with similar investment preferences. Investors should adopt and use both ethical and Islamic investment strategies, not only because such investments allow a focus beyond the bottom line, but also because their returns are comparable, if not better, to those from conventional investments.
We have examined the performance of both conventional and Islamic equities via their respective index performances, which are transparently constructed and globally visible. The comparison has shown that both are able to achieve similar investment performance despite the different index construction processes. We believe this is evidence that the Islamic investment approach is a credible complementary investment alternative that all investors should consider, with the guidance of an experienced Islamic investment manager.
